Jenkins plugin that autogrades projects based on a configurable set of metrics. Currently, you can select from the following metrics:
-
Test statistics (e.g., number of failed tests) from the JUnit Plugin
-
Code coverage (e.g., line coverage percentage) from the Coverage Plugin
-
Mutation coverage (e.g., missed mutations' percentage) from the Coverage Plugin
-
Static analysis (e.g., number of warnings) from the Warnings Plugin
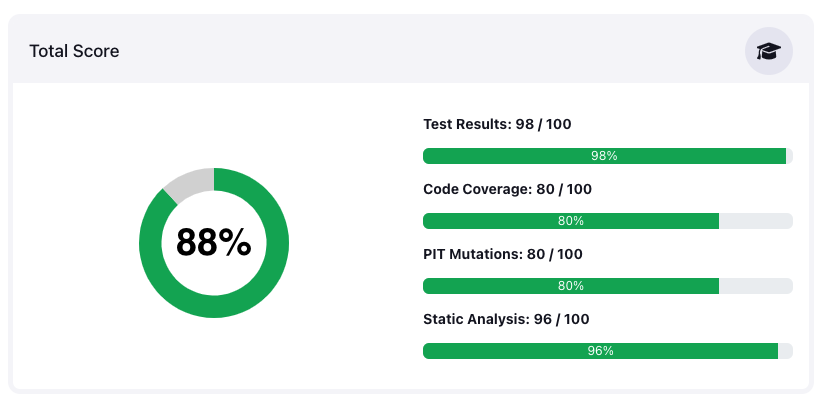
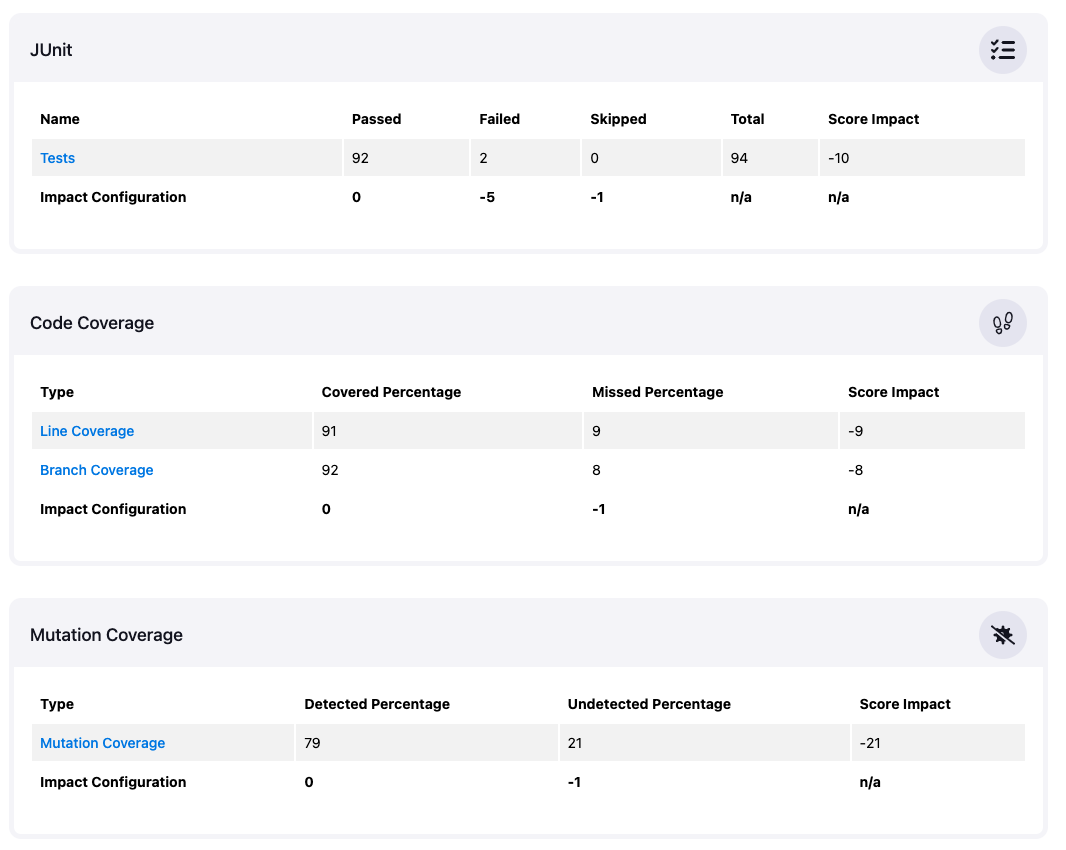
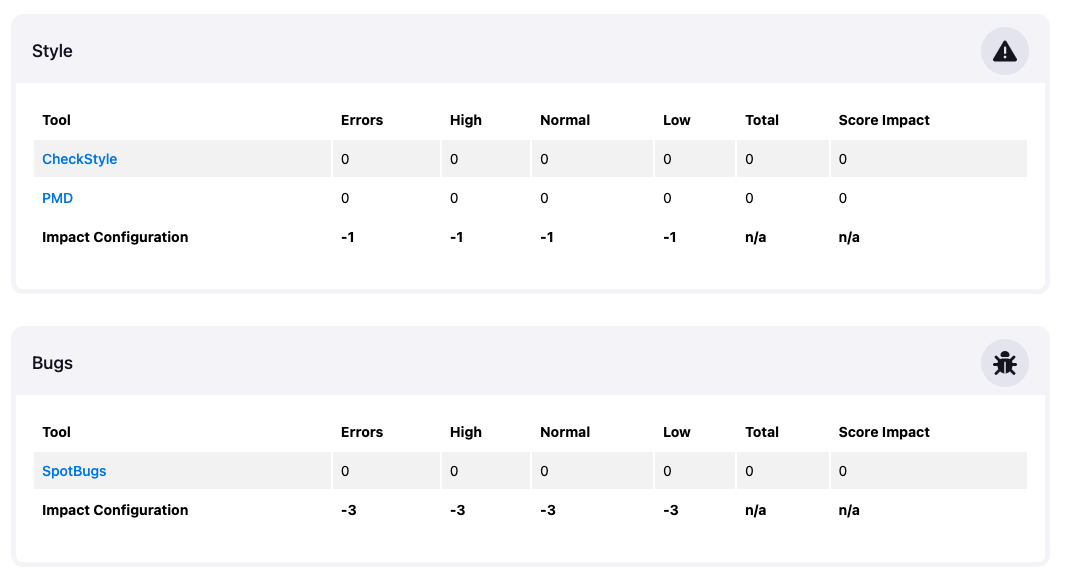
For each metric, you can define the impact on the overall score and the individual scoring criteria. After each build, the autograding plugin shows a summary in several progress charts and details in a table for each metric.
This plugin is a companion project for the GitHub Autograding Action that can be used to autograde GitHub Classroom assignments.
To autograde a project, you first need to build your project using your favorite build tool. Make sure your build invokes all tools that will produce the artifacts required for the autograding later on. Then run all post-build steps that record the desired results using the plugins from the list above. Autograding is based on the persisted Jenkins model of these plugins (i.e., Jenkins build actions), so make sure the results of these plugins show correctly up in the Jenkins build view. The autograding has to be started as the last step: you can configure the impact of the individual results using a simple JSON string, see the GitHub Autograding Action for details. Currently, no UI configuration of the configuration is available. The autograding step reads all requested build results and calculates a score based on the defined properties in the JSON configuration.
Please have a look at the example pipeline that shows how to use this plugin in practice. It consists of the following stages:
-
Checkout from SCM
-
Build and test the project and run the static analysis with Maven
-
Run the test cases and compute the line and branch coverage
-
Run PIT to compute the mutation coverage
-
Record all Maven warnings
-
Autograde the results from steps 2-5
The example pipeline uses the following configuration that shows all possible parameters:
{
  "analysis": {
    "maxScore": 100,
    "errorImpact": -10,
    "highImpact": -5,
    "normalImpact": -2,
    "lowImpact": -1
  },
  "tests": {
    "maxScore": 100,
    "passedImpact": 1,
    "failureImpact": -5,
    "skippedImpact": -1
  },
  "coverage": {
    "maxScore": 100,
    "coveredImpact": 1,
    "missedImpact": -1
  },
  "pit": {
    "maxScore": 100,
    "detectedImpact": 1,
    "undetectedImpact": -1,
    "ratioImpact": 0
  }
}
If you want to skip one of the tools, remove the corresponding JSON node from the configuration. Additionally, you need to select the individual configuration options based on your current assignment. Sometimes it makes sense to start with a given number of points and subtract points for each violation, e.g., minus points for each SpotBugs warning. For other metrics, it makes more sense to add points for each achieved percentage, e.g., for line coverage.


