Build Failure Analyzer
This plugin analyzes the causes of failed builds and presents the causes on the build page. It does this by using a knowledge base of build failure causes that is built up from scratch.
Saving statistics about failure causes is also possible.
Knowledge base
The plugin comes with an empty knowledge base of failure causes. Populating this knowledge base is done by using the link "Failure Cause Management".
The link is shown only if the permission UpdateCauses is set for the current user. Press "Create new" and add a name and a description for the Failure Cause.
The description should contain the reason why this build failed as well as possible solutions for the build failure.
One or more optional categories can be added as a whitespace-separated list. These categories are only used for the statistics part of the plugin.
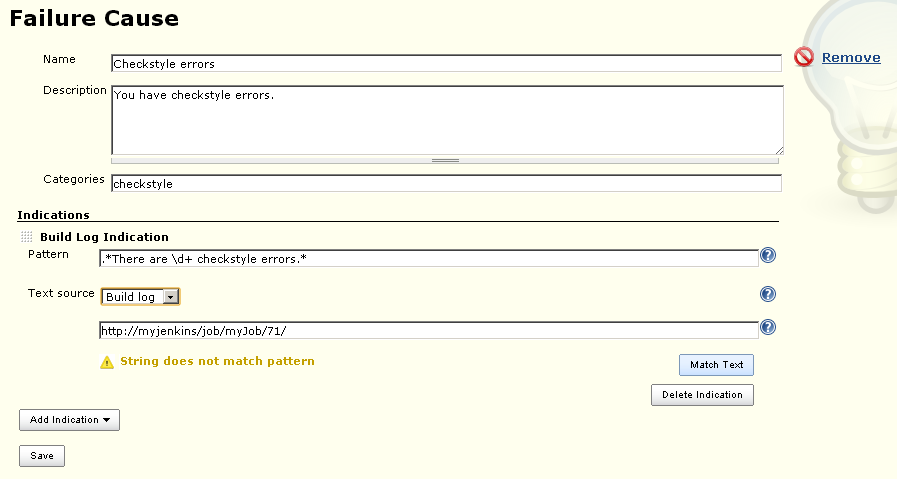
Add one or more Indications by pressing "Add Indication". By default, only one type of Indication exists, a "Build Log Indication".
Plugin developers can add new Indication types and more are planned to be added to the plugin itself.
The Build Log Indication searches through the build log, one line at a time, for a regular expression.
It uses Pattern.match, so the regular expression needs to match should be as follows

Adding new failure causes and indications to the knowledge base.
From version 1.3.1 of the plugin, regular expressions can be tested on the Failure Cause Management page, in two different ways:
- Writing a text in the text field shown above and testing against that.
- Writing a URL to a build log in the text field. The plugin then runs through the log trying to match the regexp.
When accessing the Failure Cause Management page from a build, the URL will be added to the text field automatically.
The plugin comes with two ways of saving the knowledge base:
- Local knowledge base. Saves the knowledge base in memory and serializes it as an xml file on the local Jenkins server (i.e. the "standard" Jenkins way of saving information).
- MongoDB knowledge base. Saves the knowledge base in a Mongo database. This can be used to share the
same knowledge base between servers. The knowledge base is still cached locally in-memory to avoid unnecessary database accesses.
Plugin developers can add new knowledge base types.
Build log scanning
All builds on the server that are non-successful (aborted, failed, unstable) will be scanned for all failure causes.
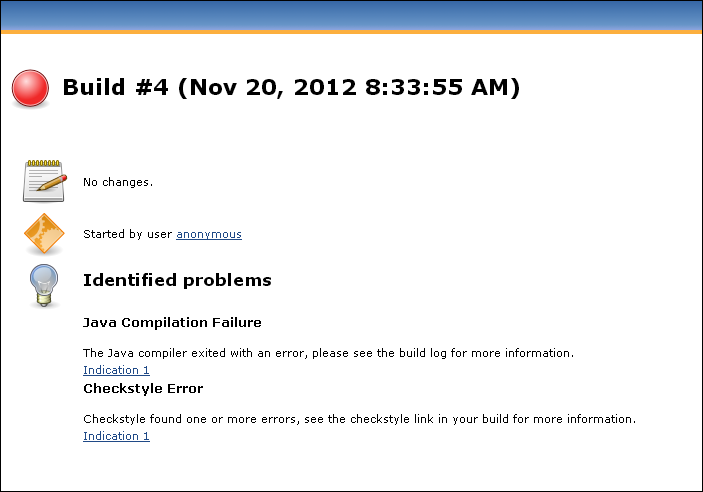
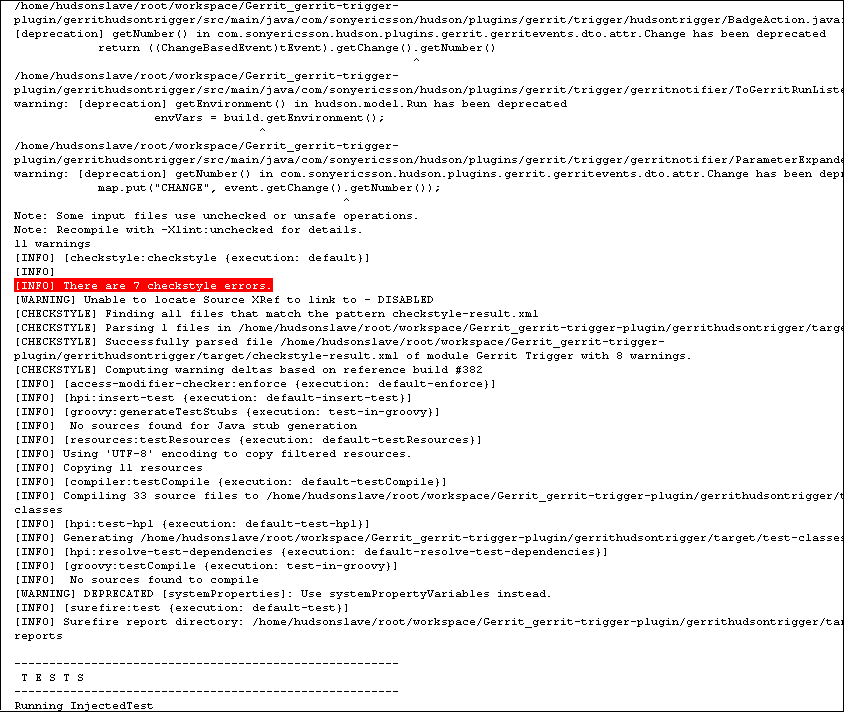
If an indication is found, the description will be put directly on the build page, with a link to the matching line in the build log.
If no cause is found, a text stating this will be shown. The text is configurable on the main configuration page of the server.

The build page when the build failure analyzer has found a failure cause.

The build log with the matching line marked in red.
Statistics
If MongoDB or some knowledge base type that supports statistics is used, statistics will be saved to that database. The same information
that is shown on the build page is saved to the database.
Administrative settings
On the configure system page in Jenkins, under Build failure analyzer, some new settings are available:
- Enabled - since the plugin scans all failed builds, we felt the need to be able to disable the scanning. Uncheck to disable.
- Text when no failure causes are found - text to show for failed builds whose failure cause is not found in the knowledge base.
- Storage type - Jenkins Local or Mongo DB, as described above. For Mongo DB, configuration details to fill in are as follows: Host, Port, Database name, Username and Password for the Database, Enable Statistics logging (described above).
- Convert knowledge base - If this check box is checked when the configuration is saved and a change has been made to the knowledge base settings, the data from the old knowledge base will be added to the new one. Note that duplicates could appear this way, so make sure that you untick this check box if you for example just have changed the username or password, or if you want to start with a clean knowledgebase.
- Send notifications to Gerrit-Trigger-plugin - if enabled, will send the text for the found failure cause via the gerrit-trigger-plugin to Gerrit.
- Concurrent scans - To speed up the scanning, each build will get a threadpool of this number of threads, with each thread handling one indication. For a small system, 3 is usually enough.
Token Macro integration
Usage:
${BUILD\_FAILURE\_ANALYZER, includeTitle=true, includeIndications=true, useHtmlFormat=true, noFailureText="Sometext"}
Parameters (=default):
- includeTitle (=true) -- When true, the "Identified problems:" title will appear over the causes.
- includeIndications (=true) -- When true, the indication numbers and links into the console log are included in the token replacement text.
- useHtmlFormat (=false) -- When true, the replacement will be an HTML snippet.
- wrapWidth (=0) -- Wrap long lines at this width. If wrapWidth is 0, the text isn't wrapped. Only applies if useHtmlFormat == false.
- noFailureText (="") -- Text to provide if there are no found failures
Token macro in Jenkins Pipeline DSL:
node {
   def buildFailure = tm('${BUILD_FAILURE_ANALYZER}')
}
Placeholders in description
Replace description placeholders from captured expressions in found indications
Substitutions may be made within the description with placeholders of the form ${I,G}, where I is the indication number and G is the captured group within the indication expression. e.g., ${1,1} would be replaced with the first indication's first captured group and ${1,2} would be replaced with the first indication's second captured group.
Guides
Releases
Tips & Tricks
Aggregate statistics to Graphite
If you are using the MongoDB KnowledgeBase, you can use these scripts in a cron job to aggregate the statistics into Graphite. Note that they only work on mongo 2.x node js driver