Run your performance tests defined with CLIF from Jenkins, and get a variety of automatically generated performance reports and charts.
Useful for: automated performance testing, performance testing in continuous integration, providing a simple web user interface for CLIF, monitoring QoS or applications QoE and possibly send alerts in case of bad responsiveness.
CLIF is an open (source), extendible performance testing software supporting a variety of load injection protocols: TCP, UDP, HTTP(S), FTP, DNS, LDAP(S), SIP, RTP, GIT, SVN, JDBC, JMS...
CLIF also embeds a probe framework to monitor arbitrary resources available on the network (via SNMP, JMX...) or on computing nodes (CPU, RAM, disks, network...)
CLIF comes with a variety of integrations and user interfaces: command-line, simple standalone GUI, full-fledged GUI integrated to Eclipse, Maven plug-in and... Jenkins plug-in.
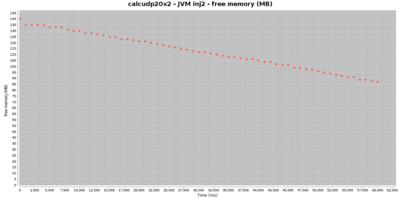
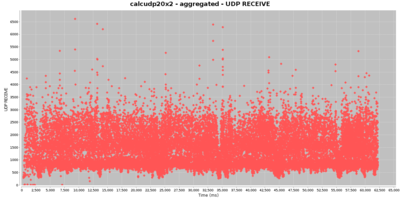
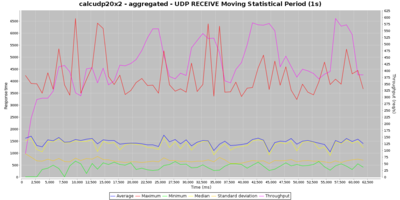
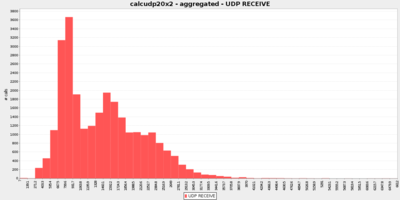
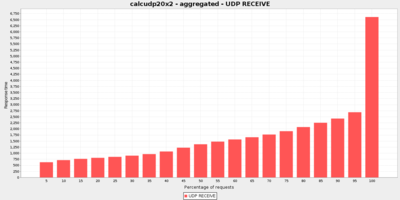
Thanks to this plug-in, you can import CLIF test projects (bundled scenarios, test plans and test data sets), typically written using CLIF's main GUI, as Jenkins jobs. Then, a detailed performance report is generated for each test run, including a global statistical analysis as well as graphs (scatter chart, moving statistics, histograms and quantiles distribution analysis) about load injectors' responses times and throughput. The CLIF performance report also provides statistics and charts about probes measurements.
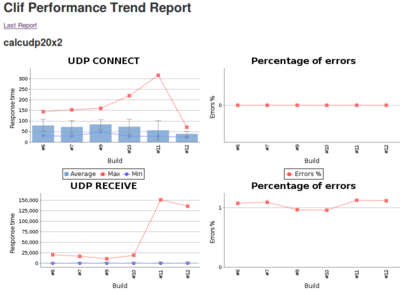
A performance trend chart is also maintained through test executions.
- FIX: compatibility with Jenkins 2.198+ (some CLIF reports failing to be generated)
- FIX: missing icons and help sections
- IMPROVEMENT: removed useless dependency with ant plug-in
Prior to running or importing any CLIF test plans, you need to install at least one CLIF runtime, typically a 2.3.7+ "CLIF server" distribution, available for download from here.
Once you have unzipped this CLIF distribution, make sure you have a Java 8+ execution environment installed.
To check your CLIF installation, run this command line:
- Windows (with cmd.exe):
C:\> C:\path\to\clif-2.3.3-server\bin\clifcmd version
Caption=Microsoft Windows 7 Enterprise
OSArchitecture=64-bit
Name=Intel(R) Core(TM) i7-5600U CPU @ 2.60GHz
java version "1.8.0_121"
Java(TM) SE Runtime Environment (build 1.8.0_121-b13)
Java HotSpot(TM) 64-Bit Server VM (build 25.121-b13, mixed mode)
clif 2.3.8 compiled 2020-Jan-13, 08:56 GMT+0000 by root
- Linux:
$ /path/to/clif-2.3.3-server/bin/clifcmd version
Linux 4.15.0-76-generic #86~16.04.1-Ubuntu SMP Mon Jan 20 11:02:50 UTC 2020 x86_64
openjdk version "1.8.0_242"
OpenJDK Runtime Environment (build 1.8.0_242-8u242-b08-0ubuntu3~16.04-b08)
OpenJDK 64-Bit Server VM (build 25.242-b08, mixed mode)
clif 2.3.8 compiled 2020-Jan-13, 08:56 GMT+0000 by root
In case Java can't be found, or the default Java environment is not appropriate, change your PATH environment variable so that the bin directory of the right Java runtime is found first.
Once the CLIF Performance Testing plug-in is installed in Jenkins, you can add the installed CLIF runtime to the Jenkins tools configuration page (Manage Jenkins>Global Tool Configuration).
Go to the Clif section, click on button Clif installations... and fill the fields:
- name (say, "CLIF 2.3.8")
- home directory (CLIF runtime's root directory, say "/path/to/clif-2.3.8-server")
- enter specific Java options to be set in CLIF's Java Virtual Machines running the tests (optional)
- Notes:
- don't care about checkbox "Install automatically" (not implemented yet)
- checkbox "Run with ProActive Scheduler?" is documented in this page
Click on Save or Apply buttons at the page bottom.
Note: you may declare as many CLIF runtimes as you need, including several instances of the same runtime (same CLIF home directory) but with different names and Java properties.
The CLIF Performance Testing plug-in provides two ways of creating a CLIF test job:
- either from a source code management system, as usual for Jenkins job;
- or by using the CLIF import wizard provided by the plug-in and available in Jenkins' main menu.
As mentioned at the top of this page, CLIF's main GUI is based on Eclipse. CLIF scenarios, test plans and possible data sets are grouped together in a CLIF project. It is straightforward to use a Source Code Management (Git, Svn...) client provided by Eclipse to push this project to an SCM repository.
Once your CLIF project is available on an SCM repository, create a new Freestyle project (New Item... > Freestyle Project). Go to the Source Code Management section and provide all necessary details about your project repository.
Then, go to the Build section, and add an Invoke Clif build step:
- choose your CLIF runtime, as previously configured in Jenkins tools
- enter your CLIF test plan file name - this file must be provided by the CLIF project that will be checked-out from the specified SCM repository
- click on Save or Apply button
Finally, you may be interested in adding a post-build action to automatically generate on each CLIF job successful completion. Refer to section below dedicated to CLIF reports configuration.
Another convenient way to proceed is to export the CLIF project as a zip archive from CLIF's Eclipse-based main GUI, and then to import it from Jenkins using wizard Import a Clif zip.
Once you have selected your CLIF project's zip file (beware of automatic refresh that tends to discard your file selection), the wizard makes you choose the CLIF runtime for the new job(s), as well as the test plans to import. One job will be created per imported test plan. However, note that all these jobs will share a common workspace, that will become visible as soon as you run the created jobs.
Click on Validate button.
Note: the import wizard also adds a Publish Clif performance report post-build action. Refer to next section to configure CLIF reports.
To get a performance report automatically generated on each successful CLIF job run, just add post-build action Publish CLIF performance report to the Post-build Actions section.
You shall keep the default value for parameter Clif report directory, unless you changed it for some reason in the advanced settings of the Invoke Clif build action.
CLIF performance reports give for each job execution:
- for each load injector, as well as for all load injectors combined:
- an array of response times statistics for each request type, as well as average throughput and total number of errors
- a collection of graphs about response times and throughput: scatter graph, moving statistics, distribution (histograms and quantiles)
- for each probe:
- an array of statistics about each monitored value
- a scatter graph for each monitored value
- for all probes and load injectors: an array of alarms
With the Advanced settings of Publish Clif performance report post-build action, you may set:
- aliases to requests, that make it possible to aggregate requests that would be considered of different types otherwise, as well as to get arbitrary request names in the report
- request success characterization, to override the test scenarios' success and failure specification
- a time sub-interval (to discard initial and/or final test phases)
- measurements statistical cleaning (to discard outstanding values)
- charts parameters (charts size, number or size of distributions categories, moving statistics time-window)
Beyond the detailed CLIF performance report generated for each CLIF job successful run, a Clif performance Trend report is also maintained to see the response time and error trends for each request type.
